Loading…

Best of the Year
Best Data Visualization & Infographics of 2026
The data visualization and infographics that won a GDUSA award in 2026, each with the firm and the designers credited.
14 award-winning projects
An infographic is how a company gets a number believed, and in a boardroom or a feed it does the work a page of prose can't. The designer decides what the data is for and picks the chart form that answers it, then edits until the point lands without a legend. Eleven infographics and data visualizations won in 2026, and So Drama! Entertainment of Singapore took three of them with series for the Singapore Armed Forces and the National Day Parade. Two independent designers took the editorial pieces: Rhea Shukla's Designing Mars and Jessica Zambo's That's Not How Redaction Works are data stories first and charts second. The best data visualization designers in the awards are on this page. Open any project to see the full graphic and learn how it was built.
Standouts of 2026
- Designing Mars: Where Data Becomes Storyby Rhea Shukla · 2026
- That’s Not How Redaction Works Data Visualizationby Jessica Zambo LLC · 2026
- Sustainability Through Large-Scale Meter Recycling Infographicby inkbyte for Utility Partners of America · 2026
- Sustainability Efforts in the Singapore Armed Forces Infographicsby So Drama! Entertainment · 2026
- Exercise Wallaby 2025 Infographicsby So Drama! Entertainment · 2026
- National Day Parade 2025 Infographics Seriesby So Drama! Entertainment · 2026

2026
Designing Mars: Where Data Becomes Story
Data Visualization & Infographics
Firm
Rhea Shukla
View Project→

2026
That’s Not How Redaction Works Data Visualization
Data Visualization & Infographics
Firm
Jessica Zambo LLC
View Project→

2026
Sustainability Through Large-Scale Meter Recycling Infographic
Data Visualization & Infographics
Firm
inkbyte
View Project→

2026
Sustainability Efforts in the Singapore Armed Forces Infographics
Data Visualization & Infographics
Firm
So Drama! Entertainment
View Project→

2026
Exercise Wallaby 2025 Infographics
Data Visualization & Infographics
Firm
So Drama! Entertainment
View Project→

2026
National Day Parade 2025 Infographics Series
Data Visualization & Infographics
Firm
So Drama! Entertainment
View Project→

2026
Well Informed Data Visualization
Data Visualization & Infographics
Firm
WebMD Health Services
View Project→

2026
Incisal Edge: 2025-2026 Dental Survey
Data Visualization & Infographics
Firm
1930 Ventures
View Project→

2026
Stream Atlanta's Interactive Office Building Skyline Report
Data Visualization & Infographics
Firm
Stream Realty Partners
View Project→

2026
College and University Benefit Study (CUBS) Infographic Series
Data Visualization & Infographics
Firm
Segal Inhouse Design (InDe)
View Project→

2026
DigiKey Infographics
Data Visualization & Infographics
Firm
Endeavor B2B
View Project→
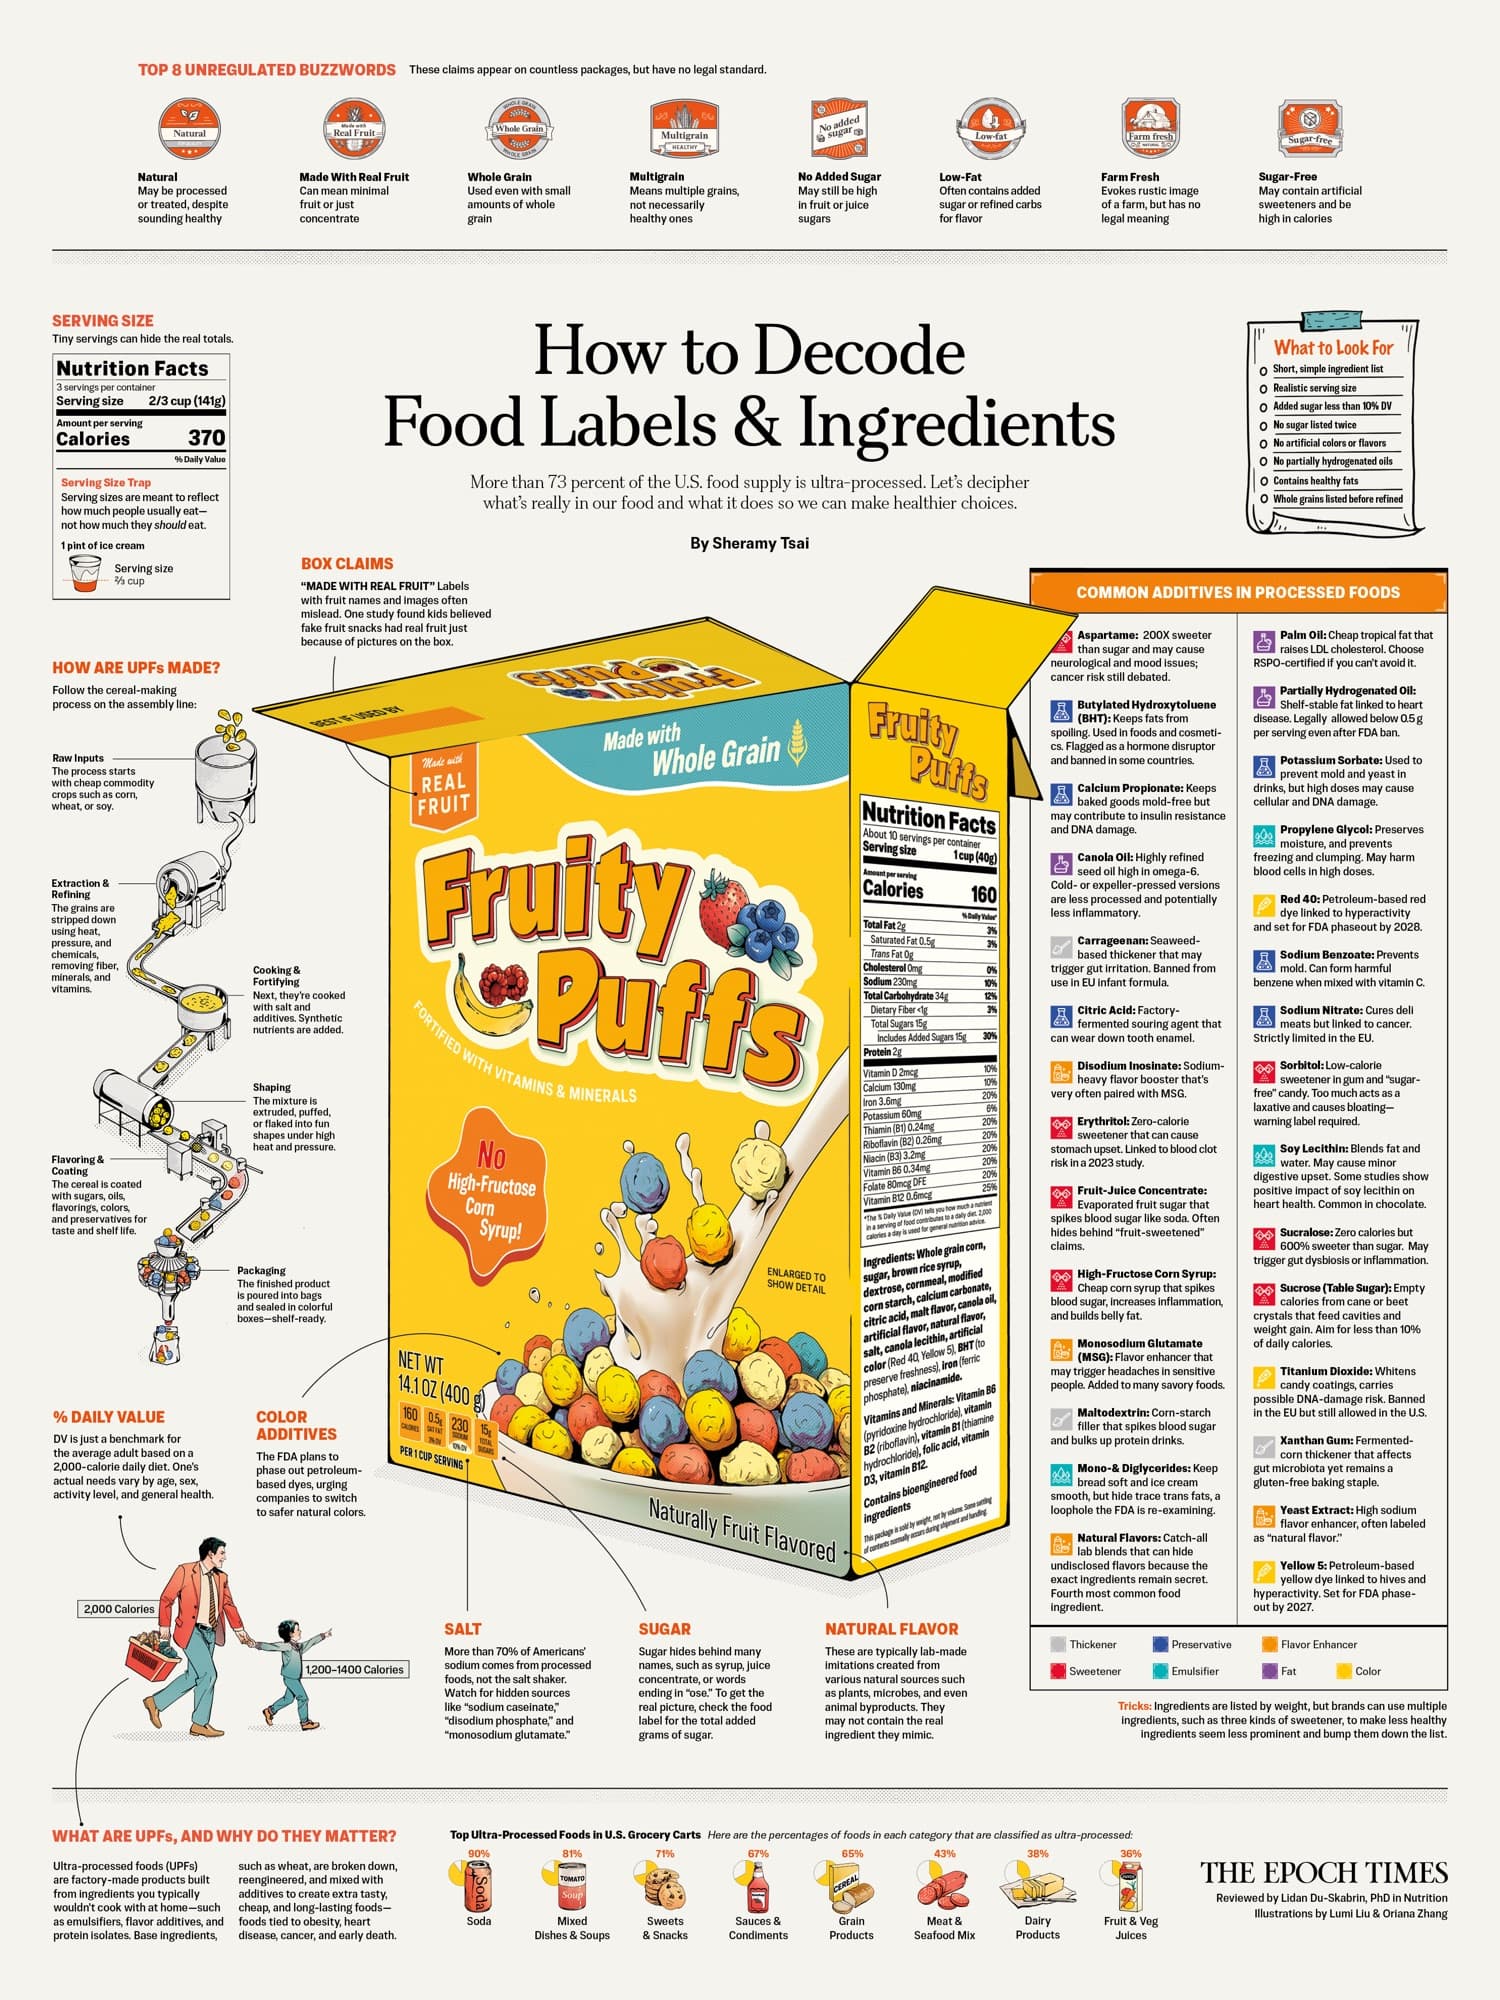
2026
How to Decode Food Labels & Ingredients Infographic
Data Visualization & Infographics
Firm
The Epoch Times
View Project→

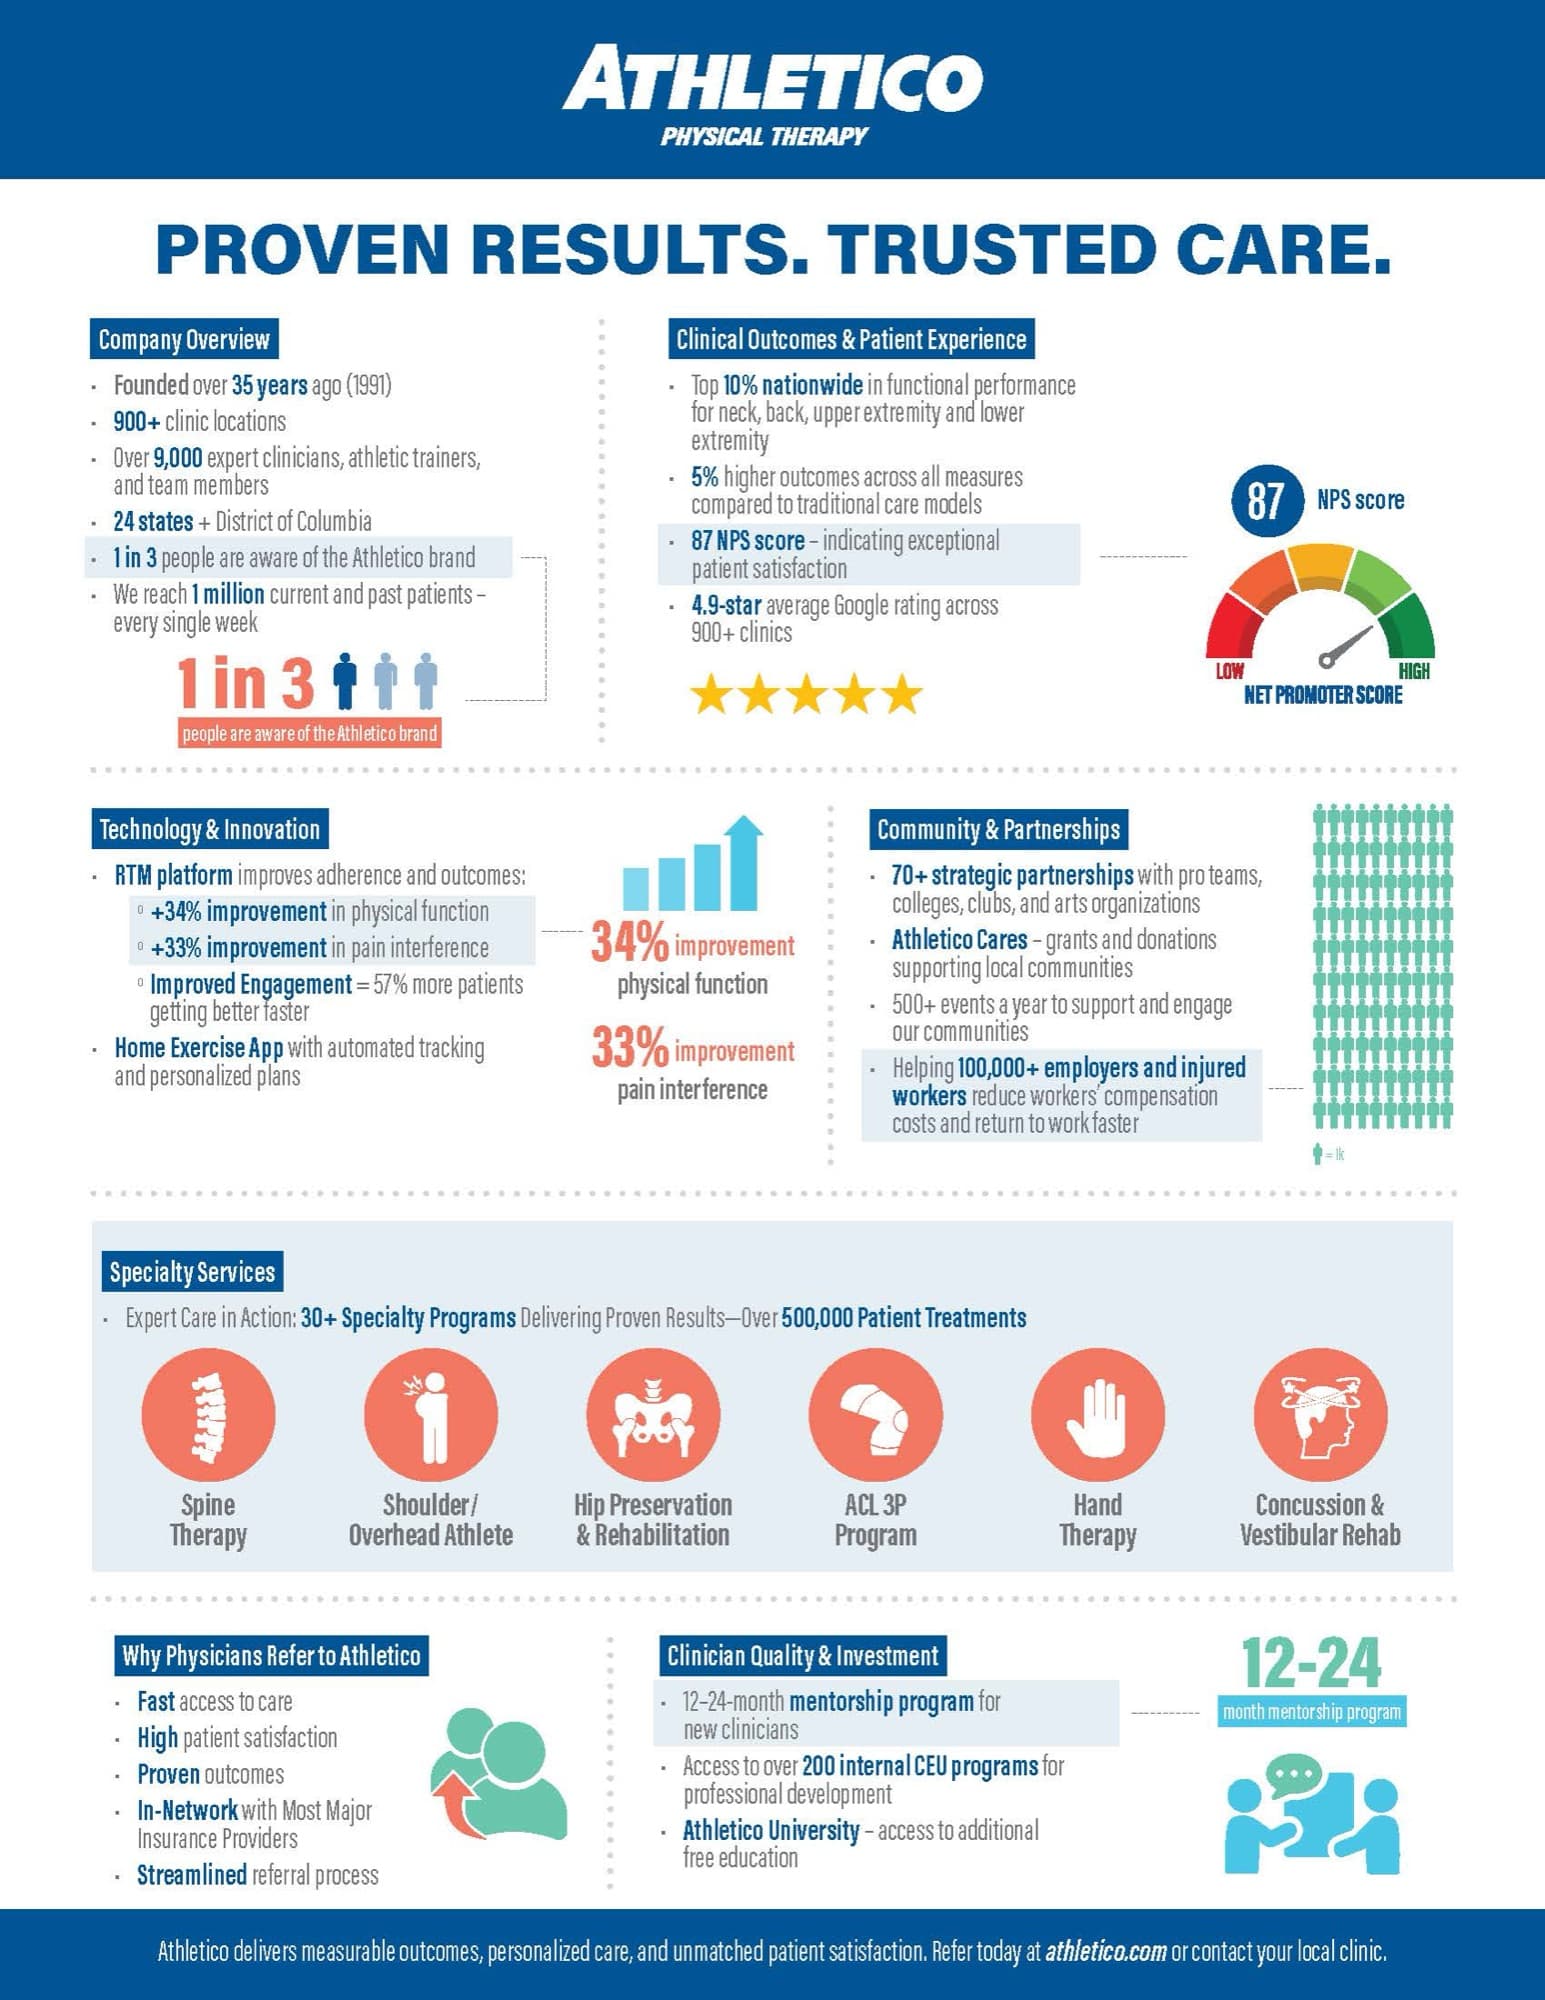
2026
Athletico Impact Snapshot: Key Stats For Referral Partners
Data Visualization & Infographics
Firm
Athletico Physical Therapy
View Project→

2026
AAD Bathing Tips for Dry Skin Relief Infographic
Data Visualization & Infographics
Firm
American Academy of Dermatology
View Project→
Featured


All Data Visualization & Infographics
Common questions
- How many data visualization and infographics won GDUSA awards in 2026?
- The gallery lists 14 winners from 2026 in this category, out of 200 across all years. Each one appears here with its firm and designer credits.
- Which firms won the most GDUSA awards for data visualization and infographics in 2026?
- So Drama! Entertainment is the only firm with more than one winner, at 3. The ranking for the year lists every firm with its winning work. Best Data Visualization & Infographics firms of 2026, by award wins.
- Who are the clients on the 2026 data visualization and infographics?
- The client named most often is Utility Partners of America. The credit comes from the firm that entered the work.
- How do I enter next year's awards?
- Entries go through the GDUSA entry platform. A single entry costs $120 as of October 2026, and packages bring the price per piece down to $400 for ten to twenty entries. Winners who publish get a project page here with full credits, and publication is the paid step. How the awards work.