Loading…

Best of the Year
Best Data Visualization & Infographics of 2019
The data visualization and infographics that won a GDUSA award in 2019, each with the firm and the designers credited.
12 award-winning projects
An infographic is how a company gets a number believed, and in a boardroom or a feed it does the work a page of prose can't. The designer decides what the data is for and picks the chart form that answers it, then edits until the point lands without a legend. The winners here are the charts you understand before you finish looking at them. So Drama! Entertainment has won 11 times turning Singapore Armed Forces exercises into infographics a recruit can read, and Jessica Zambo's That's Not How Redaction Works made a government records story visible in one spread. The best data visualization designers in the awards are on this page. Open any project to see the full graphic and learn how it was built.
Standouts of 2019
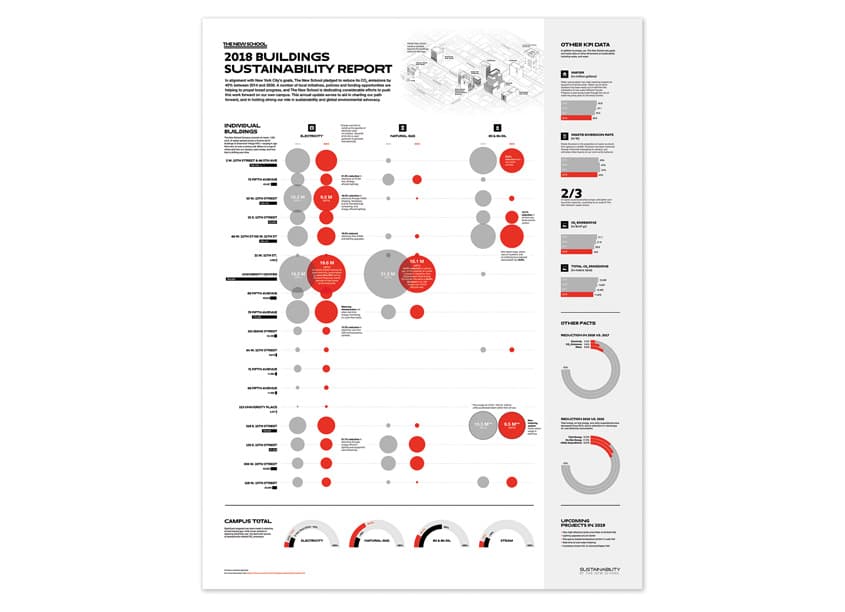
- 2018 Buildings Sustainability Reportby Siwen Li for The New School · 2019
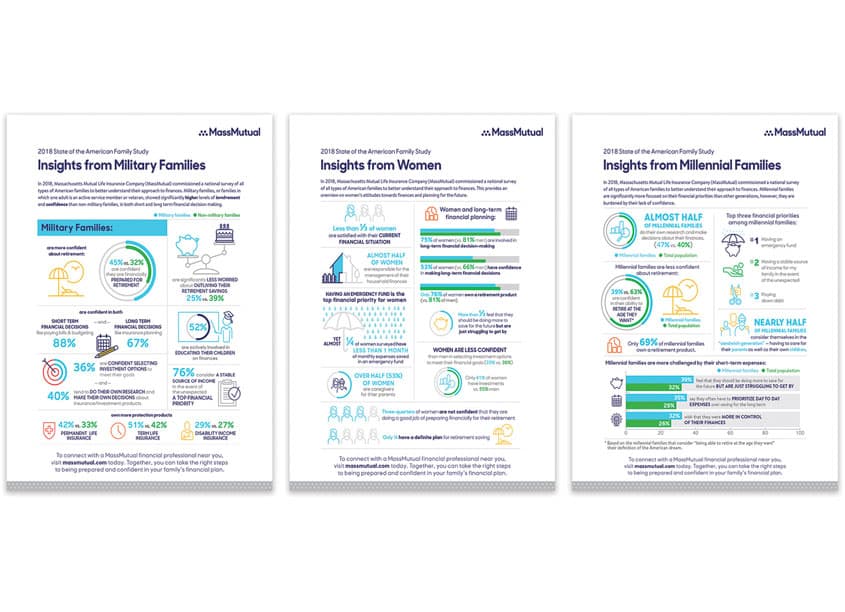
- State Of The American Family: Military, Millenial, Womenby studio m, MassMutual · 2019
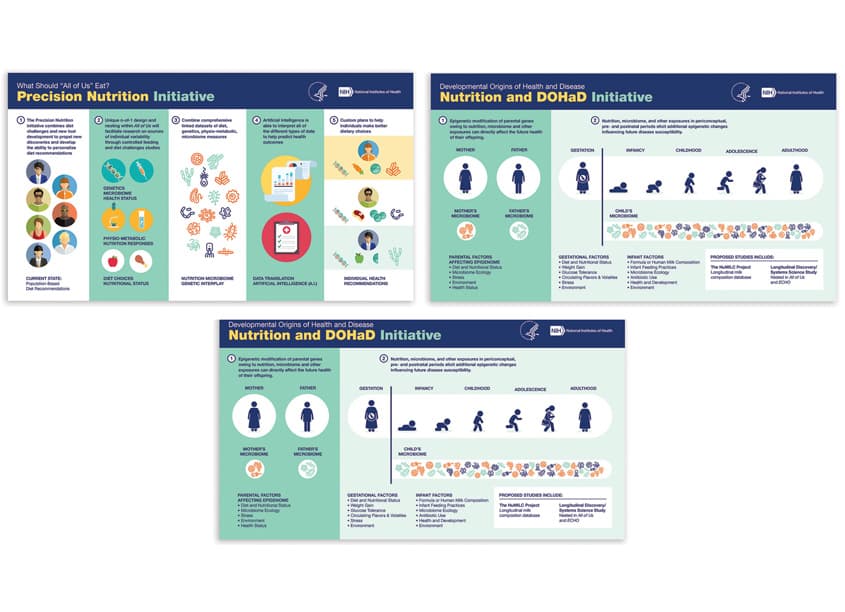
- Precision Nutrition Infographicsby NIH Medical Arts Branch · 2019
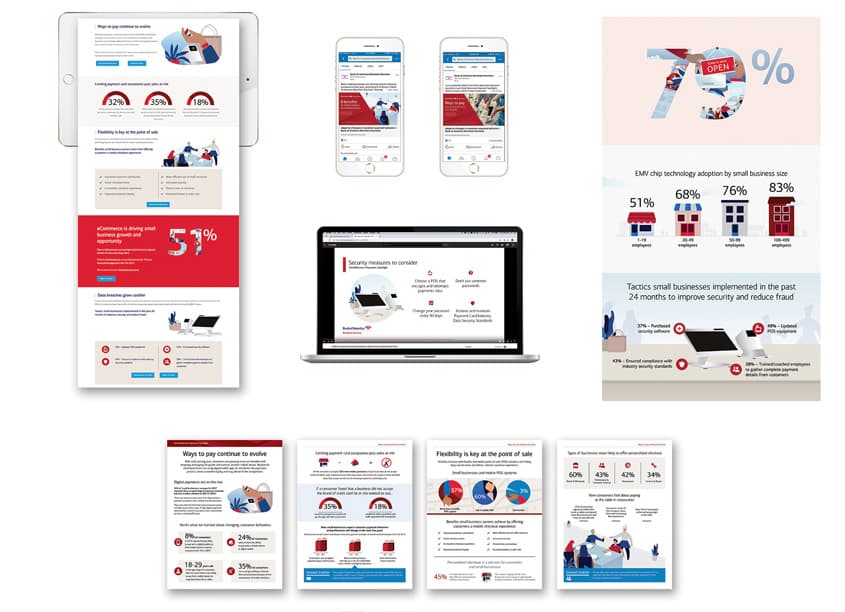
- Small Business Payments Spotlight Infographicby Bank of America Merchant Services · 2019
- Shutterstock 2019 Creative Trends Report Vice President, Creative: Mike McCabe Assistantby Shutterstock · 2019
- Employee Benefits Powerfully Simple Landing Pageby AXA In-House Agency · 2019
2019
2018 Buildings Sustainability Report
Data Visualization & Infographics
Firm
Siwen Li
View Project→
2019
State Of The American Family: Military, Millenial, Women
Data Visualization & Infographics
Firm
studio m, MassMutual
View Project→
2019
Precision Nutrition Infographics
Data Visualization & Infographics
Firm
NIH Medical Arts Branch
View Project→
2019
Small Business Payments Spotlight Infographic
Data Visualization & Infographics
Firm
Bank of America Merchant Services
View Project→
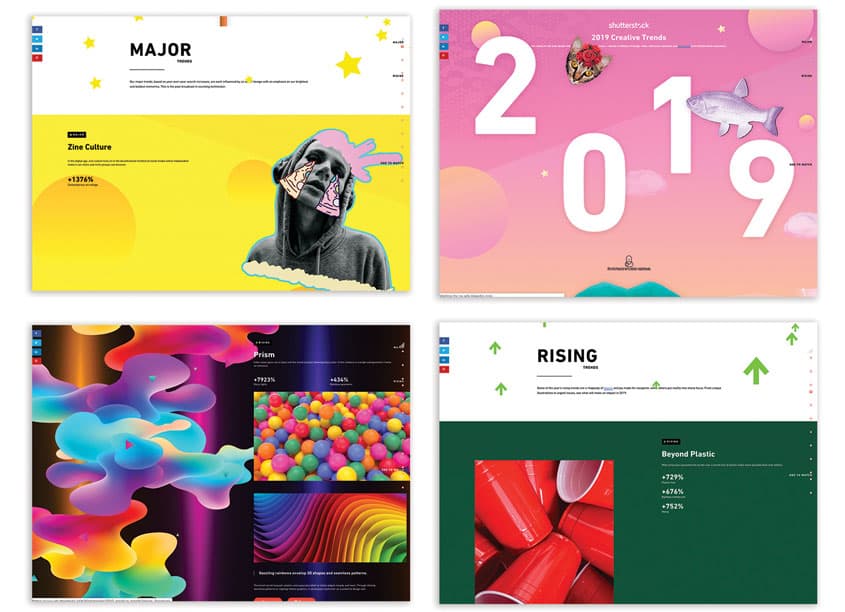
2019
Shutterstock 2019 Creative Trends Report Vice President, Creative: Mike McCabe Assistant
Data Visualization & Infographics
Firm
Shutterstock
View Project→
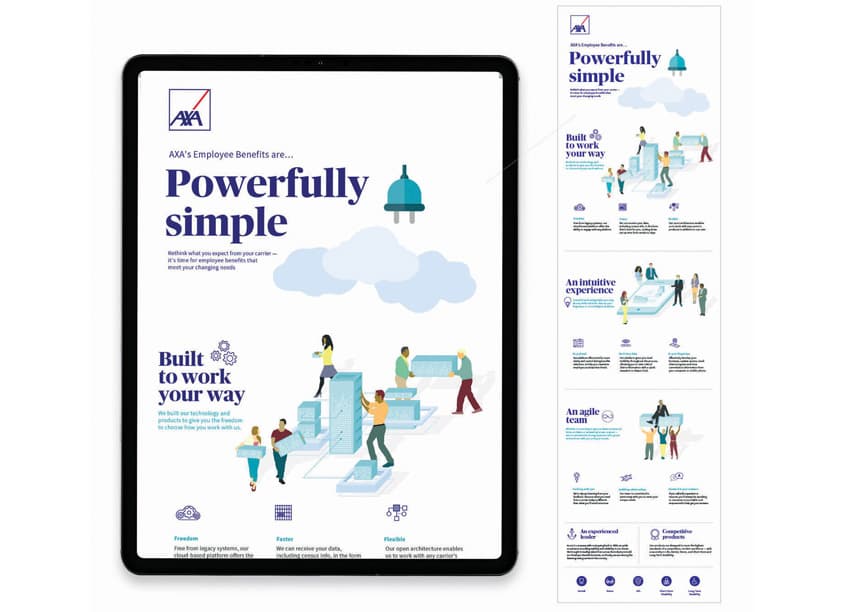
2019
Employee Benefits Powerfully Simple Landing Page
Data Visualization & Infographics
Firm
AXA In-House Agency
View Project→
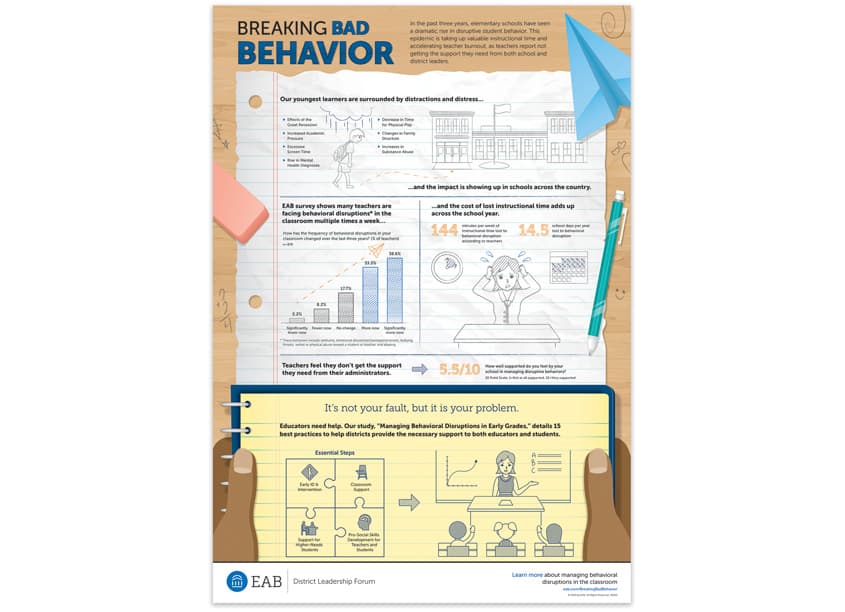
2019
Breaking Bad Behavior Infographic
Data Visualization & Infographics
Firm
EAB, Design Strategies and Solutions
View Project→
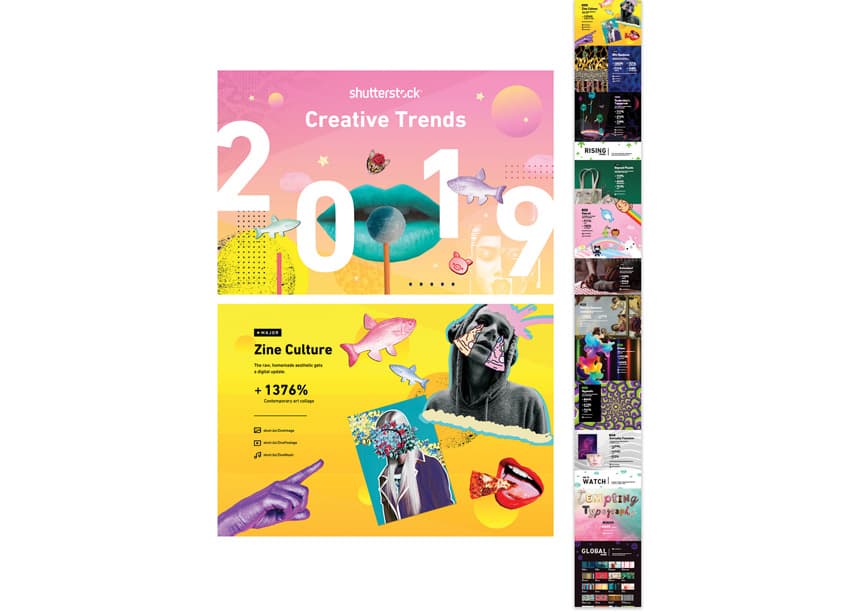
2019
Shutterstock 2019 Creative Trends Report
Data Visualization & Infographics
Firm
Shutterstock
View Project→
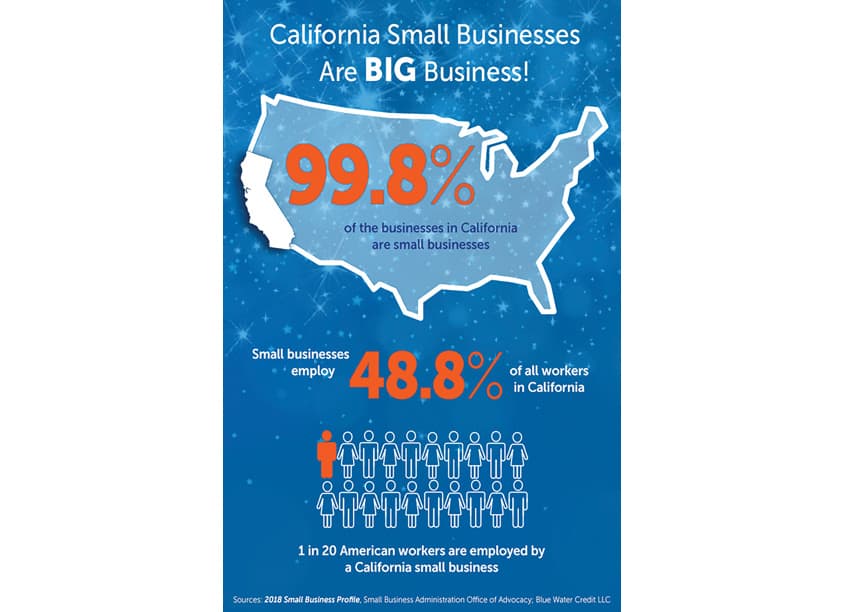
2019
National Small Business Week Infographic
Data Visualization & Infographics
Firm
The Word & Brown Companies
View Project→
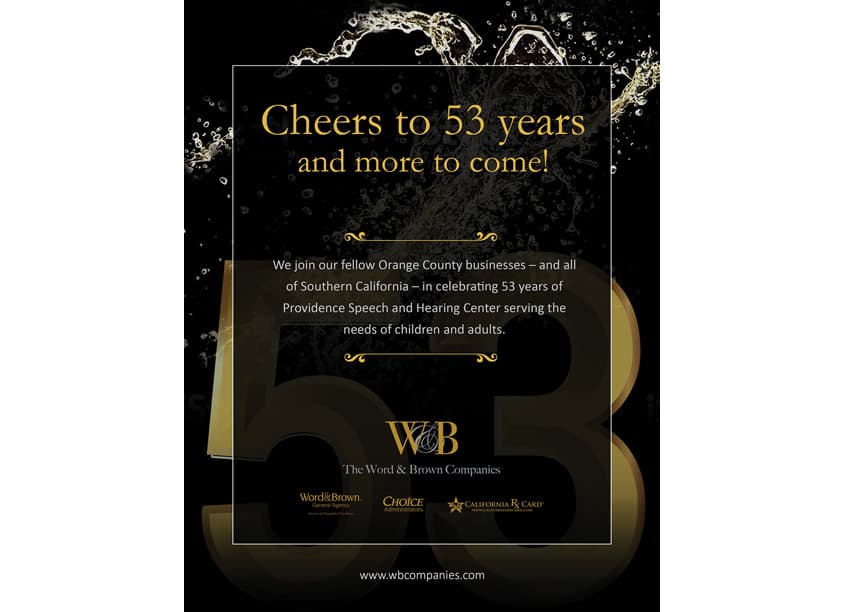
2019
Congratulations Ad For Providence Speech & Hearing Center Program
Data Visualization & Infographics
Firm
The Word & Brown Companies
View Project→
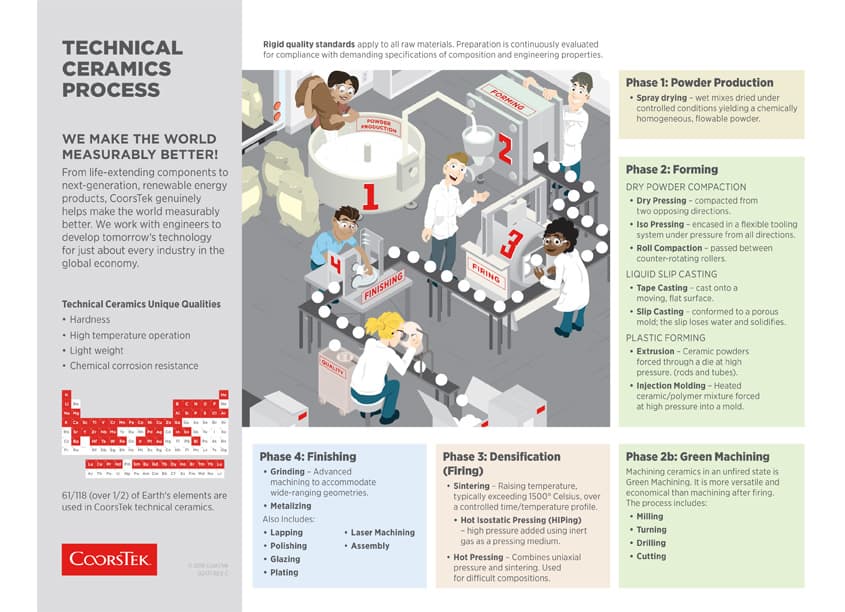
2019
CoorsTek Technical Ceramics Infographic
Data Visualization & Infographics
Firm
CoorsTek
View Project→
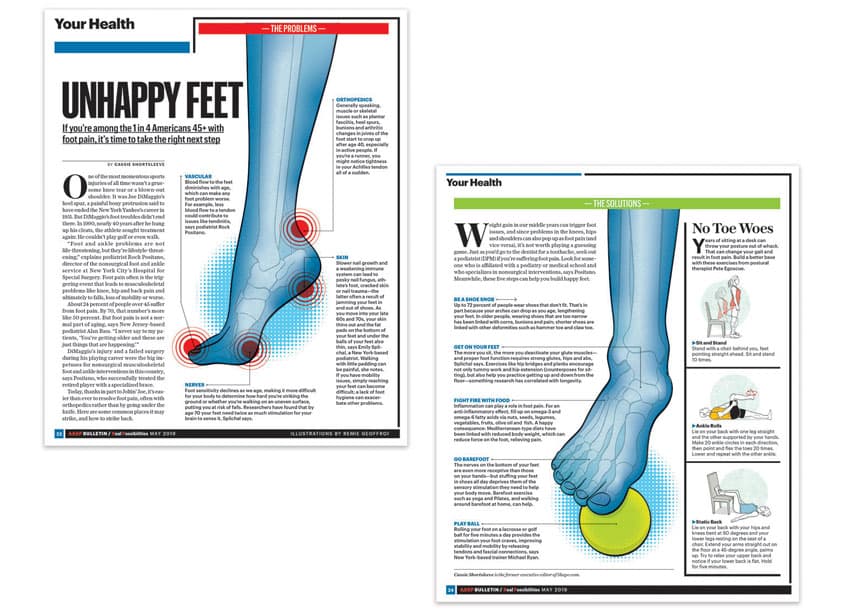
2019
Unhappy Feet
Data Visualization & Infographics
Firm
AARP Publications
View Project→

All Data Visualization & Infographics
Common questions
- How many data visualization and infographics won GDUSA awards in 2019?
- The gallery lists 12 winners from 2019 in this category, out of 200 across all years. Each one appears here with its firm and designer credits.
- Which firms won the most GDUSA awards for data visualization and infographics in 2019?
- Shutterstock and The Word & Brown Companies share the top spot with 2 of the 2019 winners each. The ranking for the year lists every firm with its winning work. Best Data Visualization & Infographics firms of 2019, by award wins.
- Who are the clients on the 2019 data visualization and infographics?
- The client named most often is The New School. The credit comes from the firm that entered the work.
- How do I enter next year's awards?
- Entries go through the GDUSA entry platform. A single entry costs $120 as of October 2026, and packages bring the price per piece down to $400 for ten to twenty entries. Winners who publish get a project page here with full credits, and publication is the paid step. How the awards work.