Loading…

Best of the Year
Best Data Visualization & Infographics of 2021
The data visualization and infographics that won a GDUSA award in 2021, each with the firm and the designers credited.
13 award-winning projects
An infographic is how a company gets a number believed, and in a boardroom or a feed it does the work a page of prose can't. The designer decides what the data is for and picks the chart form that answers it, then edits until the point lands without a legend. The winners here are the charts you understand before you finish looking at them. So Drama! Entertainment has won 11 times turning Singapore Armed Forces exercises into infographics a recruit can read, and Jessica Zambo's That's Not How Redaction Works made a government records story visible in one spread. The best data visualization designers in the awards are on this page. Open any project to see the full graphic and learn how it was built.
Standouts of 2021
- World Mental Health Day Infographicby WebMD Health Services · 2021
- The Employee and Student Experienceby Tarrant County College District/Graphic Services · 2021
- Food Allergies Infographicby Bethani Estes · 2021
- Network Of Care Interactive Infographicby AdventHealth · 2021
- Enhanced Personal Equipment For Soldiersby So Drama! Entertainment · 2021
- Maritime Security and Response Flotillaby So Drama! Entertainment · 2021
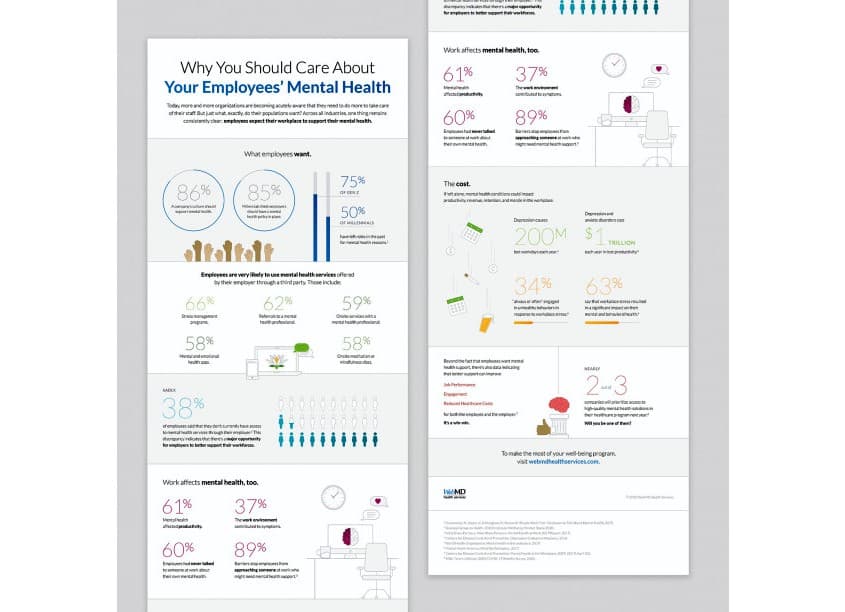
2021
World Mental Health Day Infographic
Data Visualization & Infographics
Firm
WebMD Health Services
View Project→
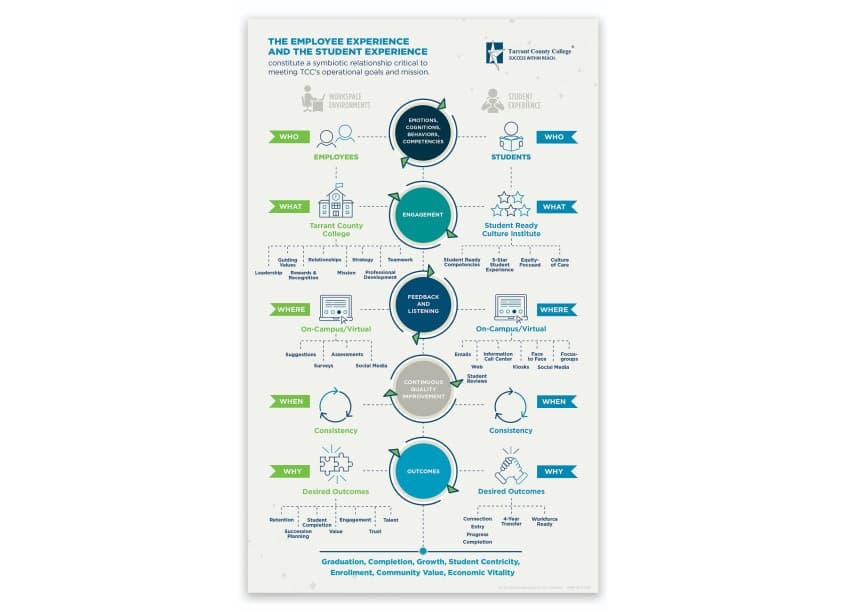
2021
The Employee and Student Experience
Data Visualization & Infographics
Firm
Tarrant County College District/Graphic Services
View Project→
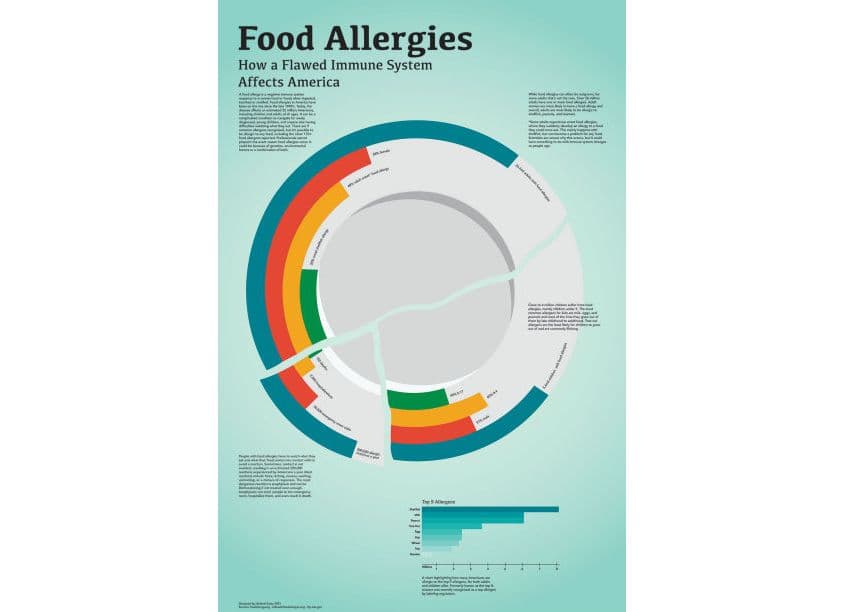
2021
Food Allergies Infographic
Data Visualization & Infographics
Firm
Bethani Estes
View Project→
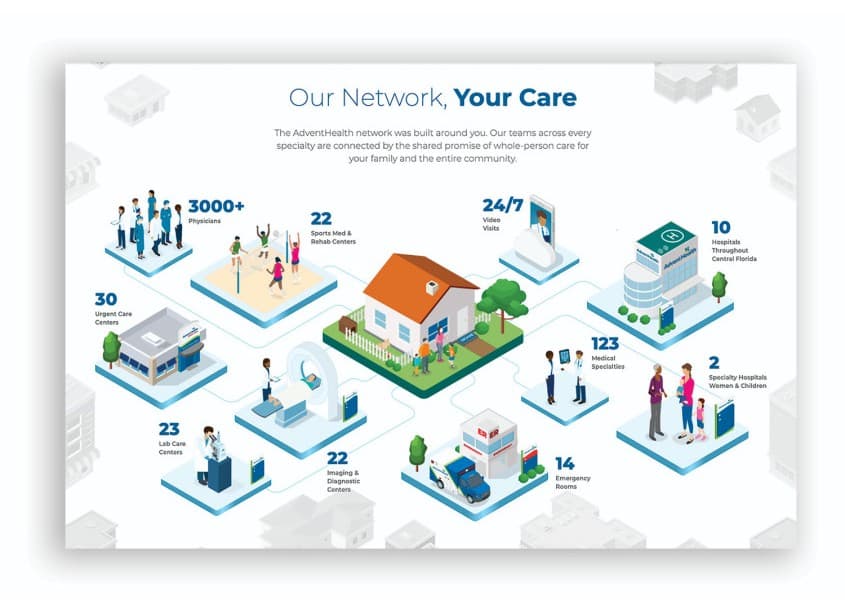
2021
Network Of Care Interactive Infographic
Data Visualization & Infographics
Firm
AdventHealth
View Project→
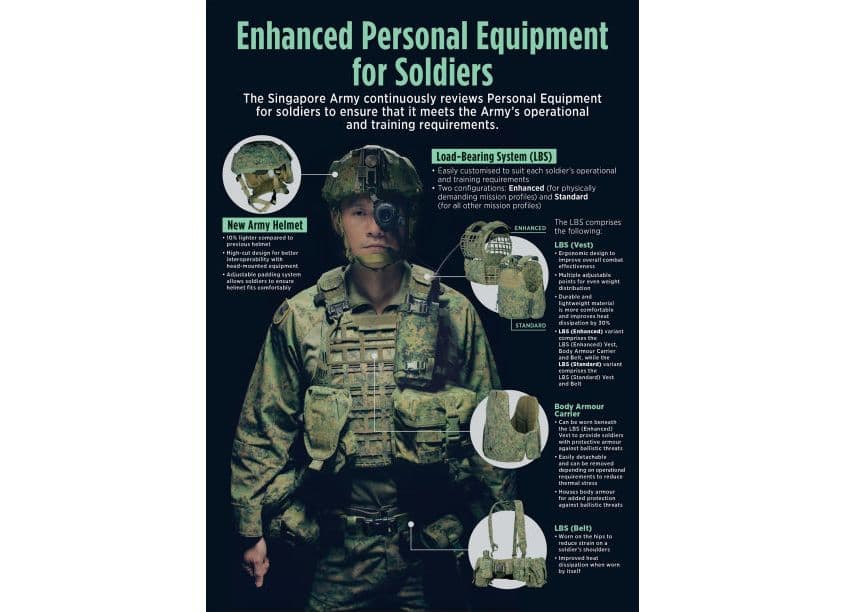
2021
Enhanced Personal Equipment For Soldiers
Data Visualization & Infographics
Firm
So Drama! Entertainment
View Project→
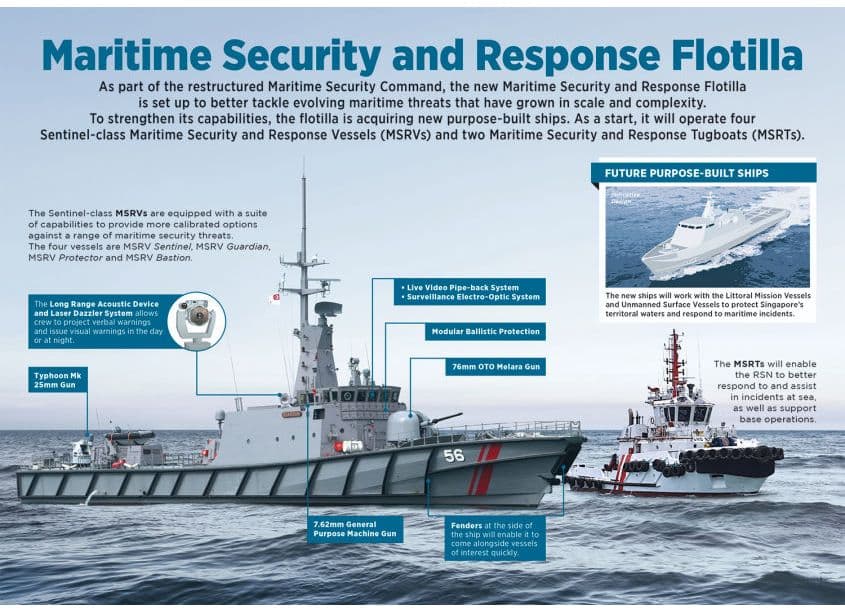
2021
Maritime Security and Response Flotilla
Data Visualization & Infographics
Firm
So Drama! Entertainment
View Project→
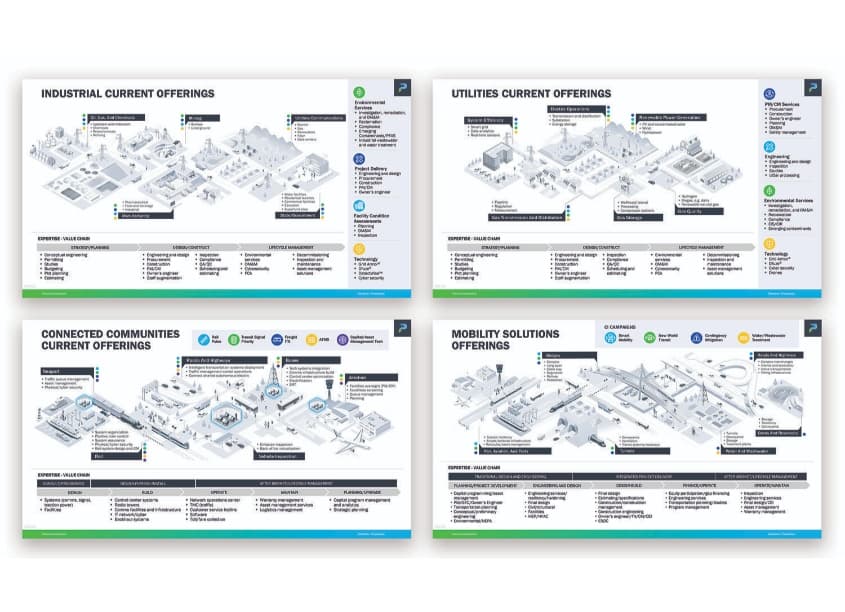
2021
Market On A Page
Data Visualization & Infographics
Firm
Parsons Core Creative Services
View Project→
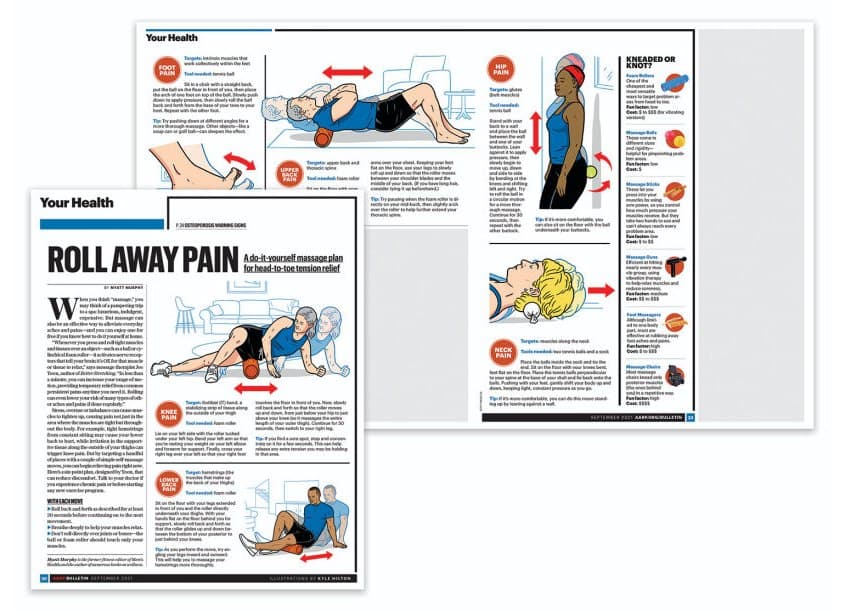
2021
Roll Away Pain, September 2021
Data Visualization & Infographics
Firm
AARP Publications
View Project→
2021
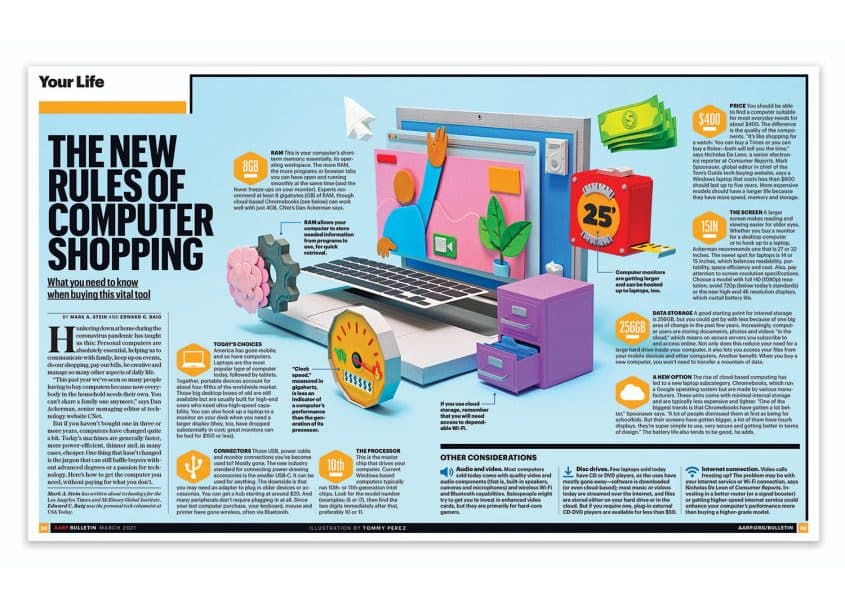
The New Rules of Computer Shopping, March 2021
Data Visualization & Infographics
Firm
AARP Publications
View Project→
2021
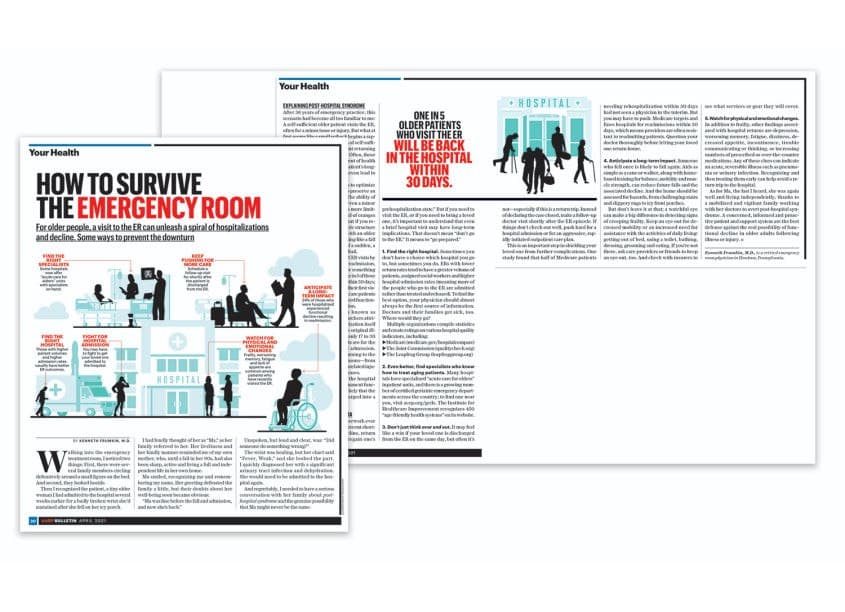
How To Survive The Emergency Room, April 2021
Data Visualization & Infographics
Firm
AARP Publications
View Project→
2021
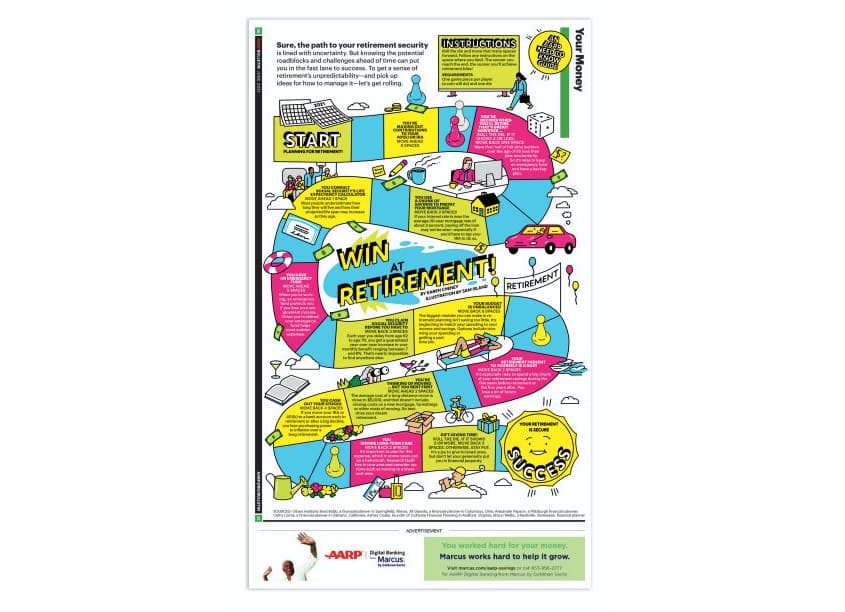
Win At Retirement, June 2021
Data Visualization & Infographics
Firm
AARP Publications
View Project→
2021
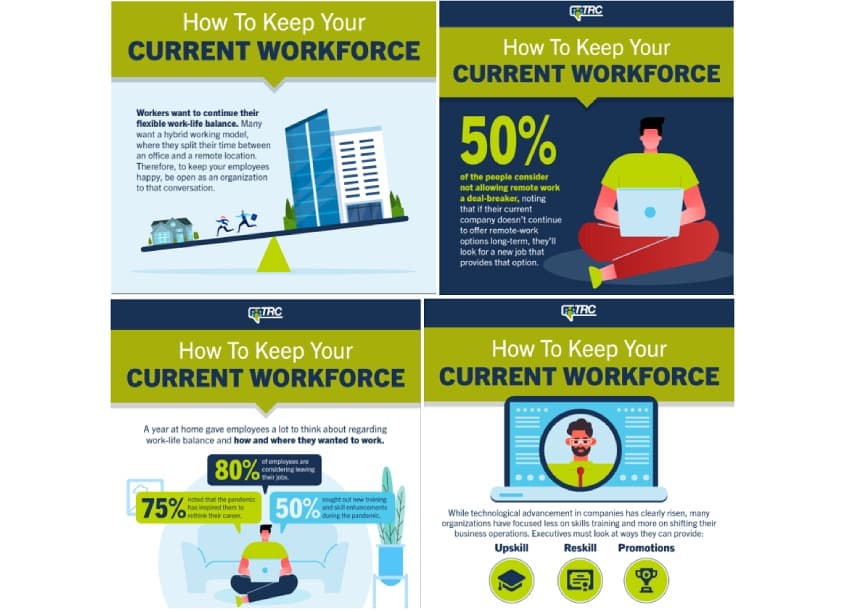
How to Keep Your Current Workforce
Data Visualization & Infographics
Firm
Black Bear Design
View Project→

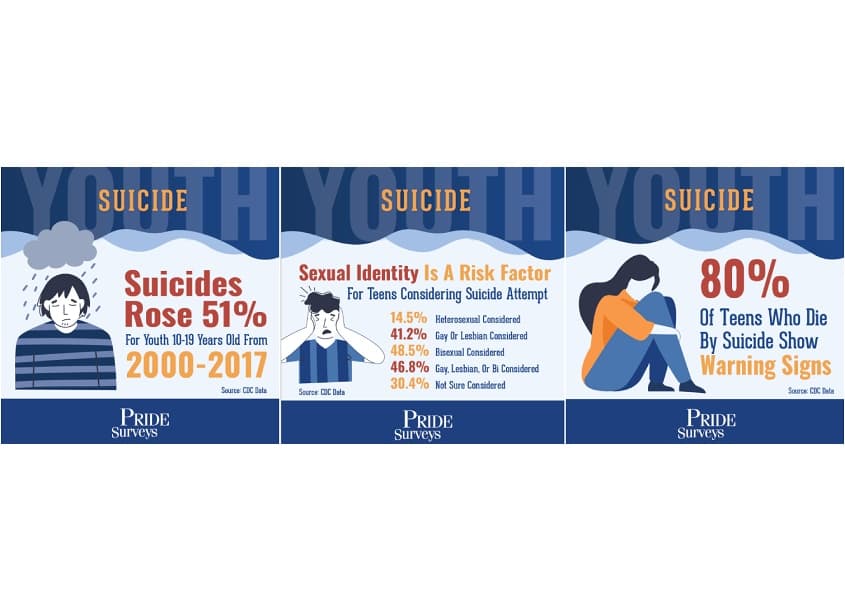
2021
Youth Suicide Survey Data
Data Visualization & Infographics
Firm
Black Bear Design
View Project→
Featured
All Data Visualization & Infographics
Common questions
- How many data visualization and infographics won GDUSA awards in 2021?
- The gallery lists 13 winners from 2021 in this category, out of 200 across all years. Each one appears here with its firm and designer credits.
- Which firms won the most GDUSA awards for data visualization and infographics in 2021?
- AARP Publications leads with 4 of the 2021 winners. Black Bear Design (2) and So Drama! Entertainment (2) are next. The ranking for the year lists every firm with its winning work. Best Data Visualization & Infographics firms of 2021, by award wins.
- Who are the clients on the 2021 data visualization and infographics?
- Clients named on this work include Pride Surveys and TRC Staffing. The credit comes from the firm that entered the work.
- How do I enter next year's awards?
- Entries go through the GDUSA entry platform. A single entry costs $120 as of October 2026, and packages bring the price per piece down to $400 for ten to twenty entries. Winners who publish get a project page here with full credits, and publication is the paid step. How the awards work.